A register read from public records
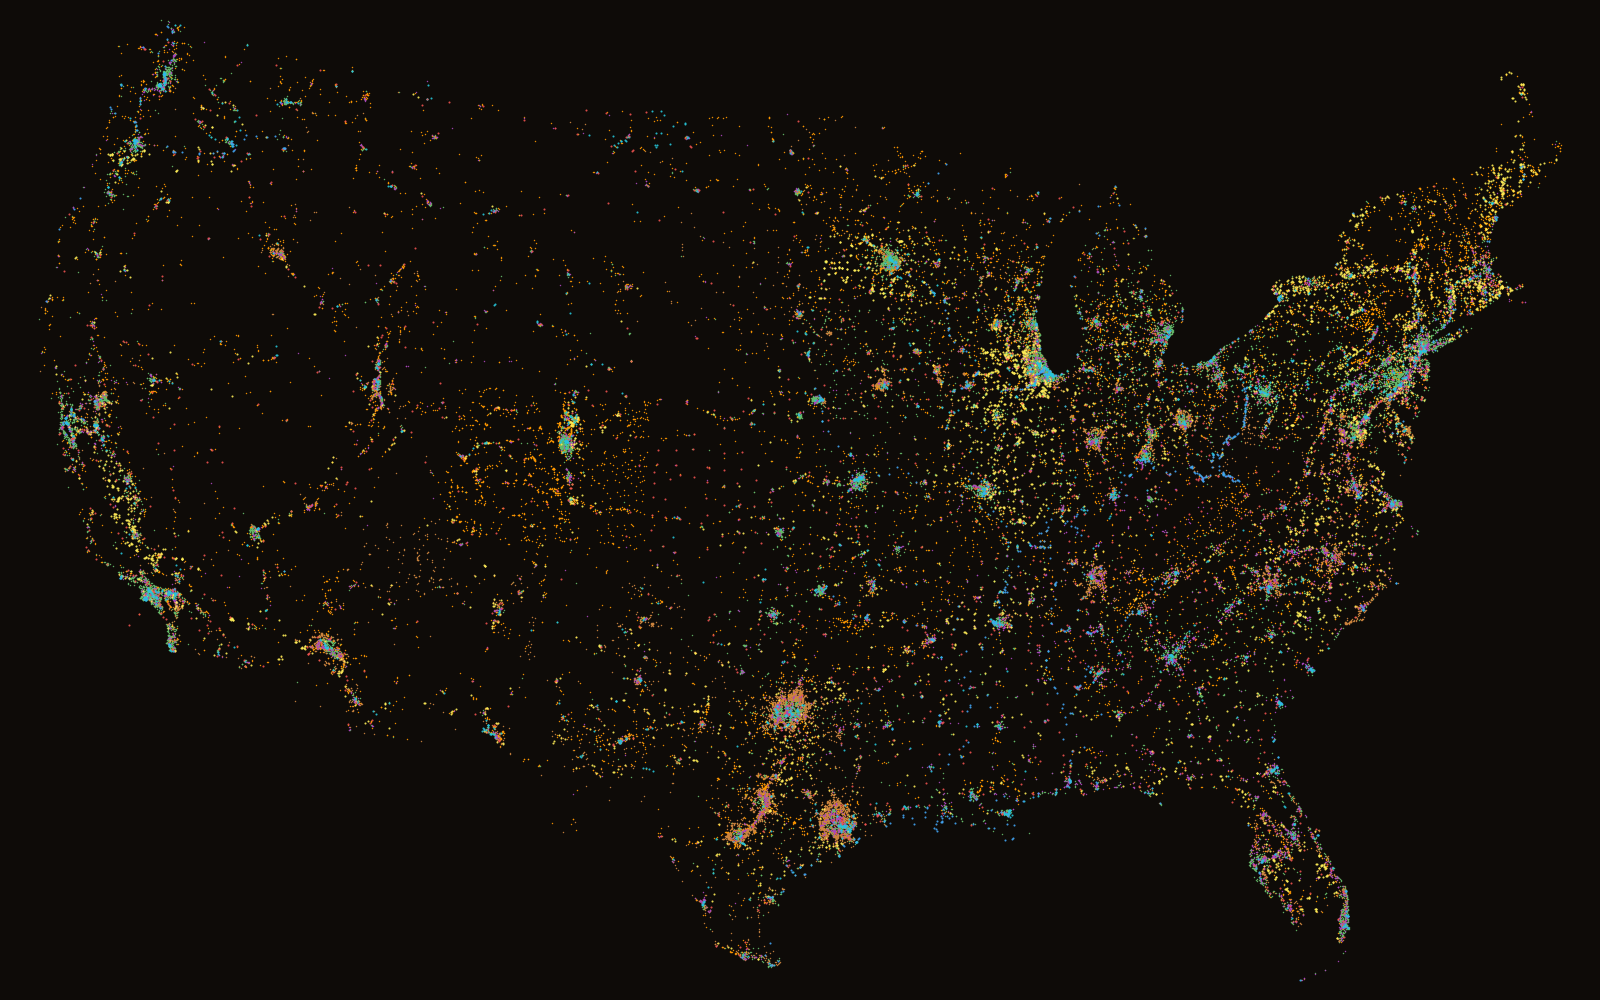
The map of where the work is
A register of 63,583 pits, quarries, mines, earthworks, solar fields, logistics yards, rail ramps, ports and landfills across the United States, read from public records, with the operating conditions at each: climate, elevation, the satellites in view above the terrain, and the domain the site works in.
Move across the map to count the sites within 100 km of the pointer.
What the register holds
63,583 sites in 8 domains
Each site is a row read from a public source. Choose a domain to see it alone on the map, with what counts as a site, where the rows come from and the licence they carry.
Operating conditions
Set the limits and the map answers
The live map holds 12 measures for every site. Drag the lower and upper bounds of a measure and the dots recolour; filter by domain, type and state; search by name. Elevation is the measure shown here.
One page per site
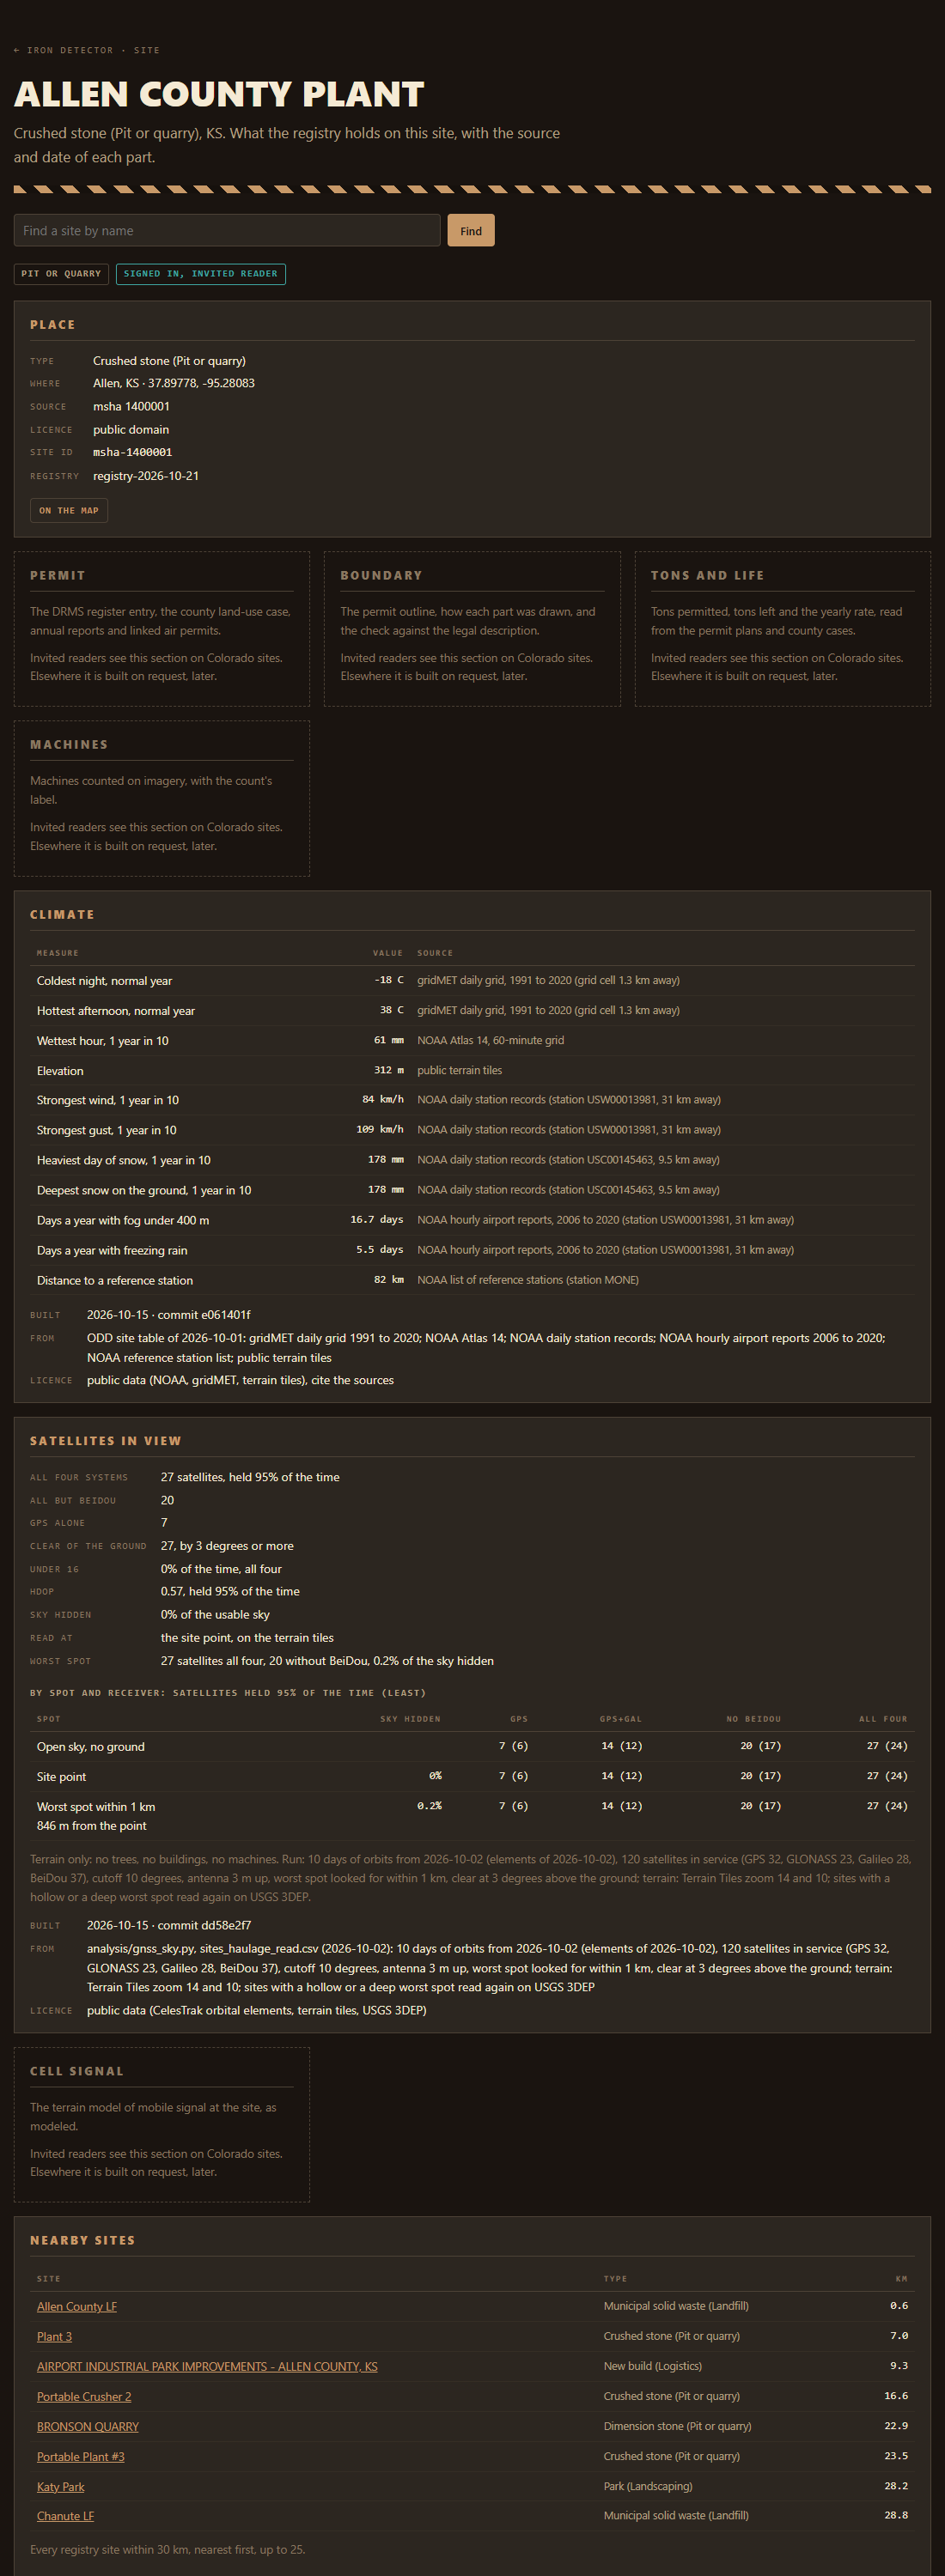
Each dot opens one page, shaped by the site's type
Every page holds the place, the climate and elevation measures from NOAA and USGS 3DEP, the GNSS satellites held in view above the terrain, and the other sites within 30 km.
The sections that cost compute or carry rights are the site fit: cell signal from a terrain model of the towers, the permit and its boundary, tons permitted and tons left, machines counted on imagery, and mowing and grooming plans run on the site's own surfaces.
On every pageSite fit
Colorado is the sample. A signed-in reader sees every section that exists for a Colorado site. Elsewhere the site fit sections are drawn locked, with a line on what each would hold, as in the page shown here.
Where it sits
One of the tools Iron Context ties together
Iron Detector is one of the mule.bot tools that Iron Context ties together: the tools, and the written interface between each pair. It answers where the work is. The tools beside it read what it finds.
Access
The map is open. A site page takes a sign-in.
The live map is open to all: every site as a dot, with its climate, elevation, reference station distance and satellites in view. The site pages are open to invited readers, one username and password each. To ask for one, write to the people who build the site.
Estimates are estimates. A count carries its confidence label, signal is as modeled, and each section of a site page names its source and date.